Health Sciences


Regional Variation in Arterial Stiffening and Dysfunction in Western Diet-induced Obesity
Increased central vascular stiffening, assessed in vivo by determination of pulse wave velocity (PWV), is an independent predictor of cardiovascular event risk. Recent evidence demonstrates that accelerated aortic stiffening occurs in obesity; however, little is known regarding stiffening of other disease-relevant arteries or whether regional variation in arterial stiffening occurs in this setting. We addressed this gap in knowledge by assessing femoral PWV in vivo in conjunction with ex vivo analyses of femoral and coronary structure and function in a mouse model of Western diet (WD; high-fat/high-sugar)-induced obesity and insulin resistance. WD feeding resulted in increased femoral PWV in vivo. Ex vivo analysis of femoral arteries revealed a leftward shift in the strain-stress relationship, increased modulus of elasticity, and decreased compliance indicative of increased stiffness following WD feeding. Confocal and multiphoton fluorescence microscopy revealed increased femoral stiffness involving decreased elastin/collagen ratio in conjunction with increased femoral transforming growth factor-β (TGF-β) content in WD-fed mice. Further analysis of the femoral internal elastic lamina (IEL) revealed a significant reduction in the number and size of fenestrae with WD feeding. Coronary artery stiffness and structure was unchanged by WD feeding. Functionally, femoral, but not coronary, arteries exhibited endothelial dysfunction, whereas coronary arteries exhibited increased vasoconstrictor responsiveness not present in femoral arteries. Taken together, our data highlight important regional variations in the development of arterial stiffness and dysfunction associated with WD feeding. Furthermore, our results suggest TGF-β signaling and IEL fenestrae remodeling as potential contributors to femoral artery stiffening in obesity.
Bender, S. B., Castorena-Gonzalez, J. A., Garro, M., Reyes-Aldasoro, C. C., Sowers, J. R., DeMarco, V. G. and Martinez-Lemus, L. A. (2015). Regional variation in arterial stiffening and dysfunction in western diet-induced obesity. AJP - Heart and Circulatory Physiology, 309(4), H574-H582. doi: 10.1152/ajpheart.00155.2015
Tracing Vasculature in Microscopy Images
The on-line image-processing algorithm traces the vessels of the microvasculature that surrounds a tumour. The algorithm is fully automatic and uses a scale space approach to detect the most relevant vessels. The intensity of the image pixels is considered to be analogous to the topographical altitude on a map and then the vessels become the equivalent of a ridge. The scale space approach will apply filters to the image to successively blur it and thus erase detail in order to detect the ridges of different widths.
Reyes-Aldasoro, C.C., Griffiths, M.K., Savas, D. & Tozer, G.M. (2010) CAIMAN: An online algorithm repository for Cancer Image Analysis. Comput. Meth. Prog. Bio. in press, doi:10.1016/j.cmpb.2010.07.007.


Deep fMRI: An End-to-End Deep Network for Classification of fMRI Data
With recent advancements in machine learning, the researchcommunity has made tremendous advances towards the clas-sification of neurological disorders from time-series func-tional MRI signals. However, existing classification tech-niques rely on hand-crafted features and classical machinelearning models. In this paper, we propose an end-to-endmodel that utilizes the representation learning capability ofdeep learning to classify a neurological disorder from fMRIdata. The proposed DeepFMRI model is comprised of threenetworks, namely (1) a feature extractor, (2) a similarity net-work, and (3) a classification network. The model takes fMRIraw time-series signals as input and outputs the predictedlabels; and is trained end-to-end using back-propagation.Experimental results on the publicly available ADHD-200dataset demonstrate that this innovative model outperformsprevious state-of-the-art.
Riaz, A., Asad, M., Al-Arif, S. M., Alonso, E. , Dima, D. , Corr, P. J. and Slabaugh, G.G. (2018). DeepFMRI: And End-to-End Deep Network for Classification of FRMI Data. Paper presented at the 2018 IEEE 15th International Symposium on Biomedical Imaging (ISBI 2018), 4-7 Apr 2018, Washington, D. C..
Finance


Hunting High and Low: Visualising Shifting Correlations in Financial Markets
The analysis of financial assets’ correlations is fundamental to many aspects of finance theory and practice, especially modern portfolio theory and the study of risk. In order to manage investment risk, in-depth analysis of changing correlations is needed, with both high and low correlations between financial assets (and groups thereof) important to identify. In this paper, we propose a visual analytics framework for the interactive analysis of relations and structures in dynamic, high-dimensional correlation data. We conduct a series of interviews and review the financial correlation analysis literature to guide our design. Our solution combines concepts from multi-dimensional scaling, weighted complete graphs and threshold networks to present interactive, animated displays which use proximity as a visual metaphor for correlation and animation stability to encode correlation stability. We devise interaction techniques coupled with context-sensitive auxiliary views to support the analysis of subsets of correlation networks. As part of our contribution, we also present behaviour profiles to help guide future users of our approach. We evaluate our approach by checking the validity of the layouts produced, presenting a number of analysis stories, and through a user study. We observe that our solutions help unravel complex behaviours and resonate well with study participants in addressing their needs in the context of correlation analysis in finance.
————
Simon, P.M. and Turkay, C., 2018, June. Hunting High and Low: Visualising Shifting Correlations in Financial Markets. In Computer Graphics Forum (Vol. 37, No. 3, pp. 479-490).
Continual Learning Augmented Investment Decisions
Investment decisions can benefit from incorporating an accumulated knowledge of the past to drive future decision making. We introduce Continual Learning Augmentation (CLA) which is based on an explicit memory structure and a feed forward neural network (FFNN) base model and used to drive long term financial investment decisions. We demonstrate that our approach improves accuracy in investment decision making while memory is addressed in an explainable way. Our approach introduces novel remember cues, consisting of empirically learned change points in the absolute error series of the FFNN. Memory recall is also novel, with contextual similarity assessed over time by sampling distances using dynamic time warping (DTW). We demonstrate the benefits of our approach by using it in an expected return forecasting task to drive investment decisions. In an investment simulation in a broad international equity universe between 2003-2017, our approach significantly outperforms FFNN base models. We also illustrate how CLA’s memory addressing works in practice, using a worked example to demonstrate the explainability of our approach.
———
Philps, D., Weyde, T., Garcez, A.D.A. and Batchelor, R., 2018. Continuous Learning Augmented Investment Decisions. arXiv preprint arXiv:1812.02340.

Transport


Visualizing the dynamics of London's bicycle hire scheme
Visualizing flows between origins and destinations can be straightforward when dealing with small numbers of journeys or simple geographies. Representing flows as lines embedded in geographic space has commonly been used to map transport flows, especially when geographic patterns are important as they are when characterising cities or managing transportation. However, for larger numbers of flows, this approach requires careful design to avoid problems of occlusion, salience bias and information overload. Driven by the requirements identified by users and managers of the London Bicycle Hire scheme we present three methods of representation of bicycle hire use and travel patterns. Flow maps with curved flow symbols are used to show overviews in flow structures. Gridded views of docking station location that preserve geographic relationships are used to explore docking station status over space and time in a graphically efficient manner. Origin-Destination maps that visualise the OD matrix directly while maintaining geographic context are used to provide visual details on demand. We use these approaches to identify changes in travel behaviour over space and time, to aid station rebalancing and to provide a framework for incorporating travel modelling and simulation.
———
Wood, J., Slingsby, A. and Dykes, J. (2011). Visualizing the dynamics of London's bicycle hire scheme. Cartographica, 46(4), pp. 239-251.
Analysis of Flight Variability: a Systematic Approach
In movement data analysis, there exists a problem of comparing multiple trajectories of moving objects to common or distinct reference trajectories. We introduce a general conceptual framework for comparative analysis of trajectories and an analytical procedure, which consists of (1) finding corresponding points in pairs of trajectories, (2) computation of pairwise difference measures, and (3) interactive visual analysis of the distributions of the differences with respect to space, time, set of moving objects, trajectory structures, and spatio-temporal context. We propose a combination of visualisation, interaction, and data transformation techniques supporting the analysis and demonstrate the use of our approach for solving a challenging problem from the aviation domain.
————
Andrienko, N. , Andrienko, G. , Garcia, J. M. C. and Scarlatti, D. (2018). Analysis of Flight Variability: a Systematic Approach. IEEE Transactions on Visualization and Computer Graphics, doi: 10.1109/TVCG.2018.2864811
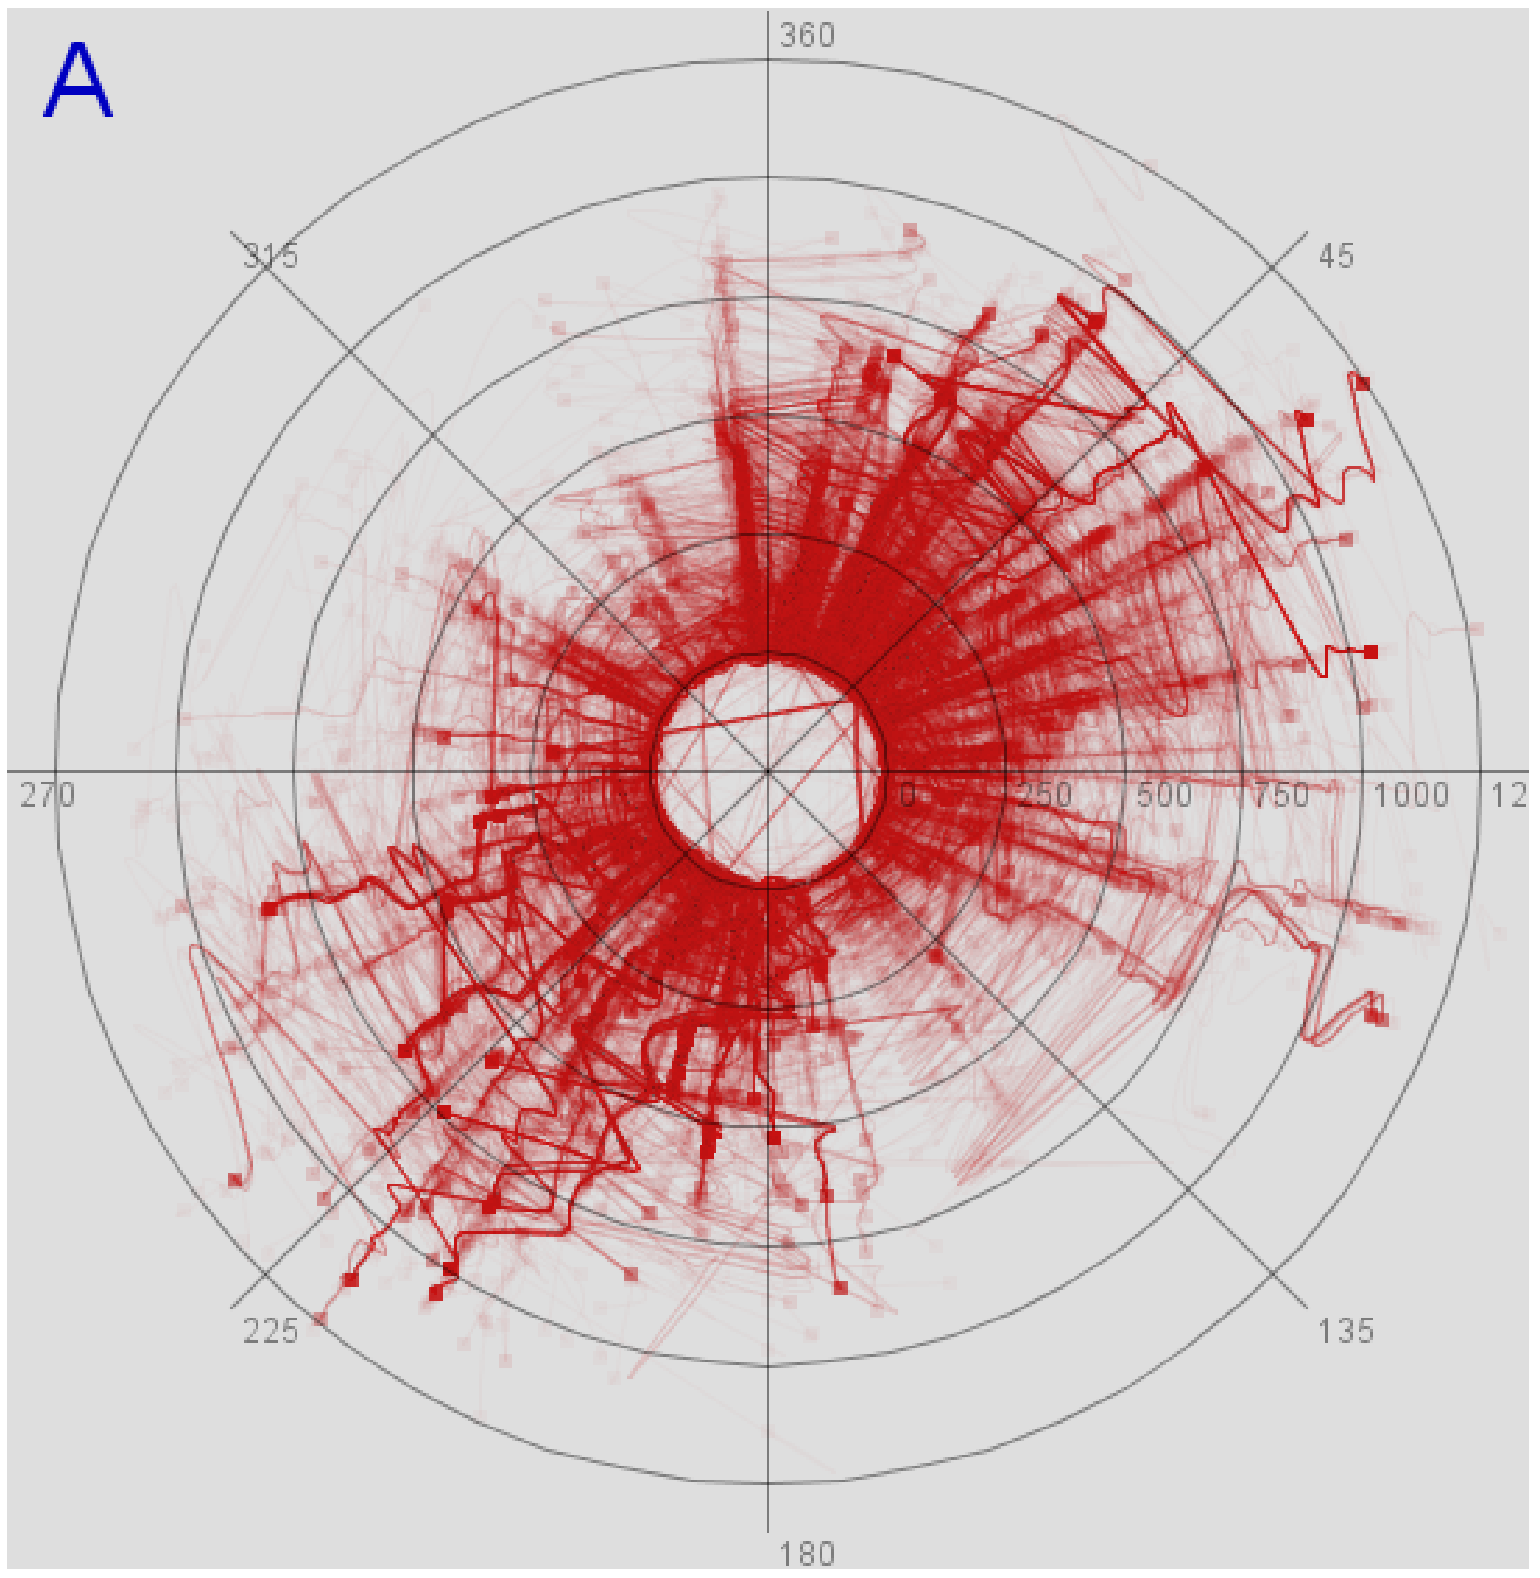

Applications of Trajectory Data From the Perspective of a Road Transportation Agency: Literature Review and Maryland Case Study
Transportation agencies have an opportunity to leverage increasingly-available trajectory datasets to improve their analyses and decision-making processes. However, this data is typically purchased from vendors, which means agencies must understand its potential benefits beforehand in order to properly assess its value relative to the cost of acquisition. While the literature concerned with trajectory data is rich, it is naturally fragmented and focused on technical contributions in niche areas, which makes it difficult for government agencies to assess its value across different transportation domains. To overcome this issue, the current paper explores trajectory data from the perspective of a road transportation agency interested in acquiring trajectories to enhance its analyses. The paper provides a literature review illustrating applications of trajectory data in six areas of road transportation systems analysis: demand estimation, modeling human behavior, designing public transit, traffic performance measurement and prediction, environment and safety. In addition, it visually explores 20 million GPS traces in Maryland, illustrating existing and suggesting new applications of trajectory data.
———
Markovic, N., Sekula, P., Vander Laan, Z., Andrienko, G. and Andrienko, N. (2018). Applications of Trajectory Data From the Perspective of a Road Transportation Agency: Literature Review and Maryland Case Study. IEEE Transactions on Intelligent Transportation Systems, doi: 10.1109/TITS.2018.2843298
Creative Industries


Visual Analysis of Pressure in Football
Modern movement tracking technologies enable acquisition of high quality data about movements of the players and the ball in the course of a football match. However, there is a big difference between the raw data and the insights into team behaviors that analysts would like to gain. To enable such insights, it is necessary first to establish relationships between the concepts characterizing behaviors and what can be extracted from data. This task is challenging since the concepts are not strictly defined. We propose a computational approach to detecting and quantifying the relationships of pressure emerging during a game. Pressure is exerted by defending players upon the ball and the opponents. Pressing behavior of a team consists of multiple instances of pressure exerted by the team members. The extracted pressure relationships can be analyzed in detailed and summarized forms with the use of static and dynamic visualizations and interactive query tools. To support examination of team tactics in different situations, we have designed and implemented a novel interactive visual tool “time mask”. It enables selection of multiple disjoint time intervals in which given conditions are fulfilled. Thus, it is possible to select game situations according to ball possession, ball distance to the goal, time that has passed since the last ball possession change or remaining time before the next change, density of players’ positions, or various other conditions. In response to a query, the analyst receives visual and statistical summaries of the set of selected situations and can thus perform joint analysis of these situations. We give examples of applying the proposed combination of computational, visual, and interactive techniques to real data from games in the German Bundesliga, where the teams actively used pressing in their defense tactics.
Andrienko, G., Andrienko, N., Budziak, G., Dykes, J., Fuchs, G., Von Landesberger, T. and Weber, H. (2017). Visual analysis of pressure in football. Data Mining and Knowledge Discovery, 31(6), pp. 1793-1839. doi: 10.1007/s10618-017-0513-2
Singing Voice Separation with Deep U-Net Convolutional Networks
The decomposition of a music audio signal into its vocal and backing track components is analogous to image-to-image translation, where a mixed spectrogram is transformed into its constituent sources. We propose a novel application of the U-Net architecture — initially developed for medical imaging — for the task of source separation, given its proven capacity for recreating the fine, low-level detail required for high-quality audio reproduction. Through both quantitative evaluation and subjective assessment, experiments demonstrate that the proposed algorithm achieves state-of-the-art performance.
Jansson, A., Humphrey, E., Montecchio, N., Bittner, R., Kumar, A. and Weyde, T. (2017). Singing voice separation with deep U-Net convolutional networks. Paper presented at the 18th International Society for Music Information Retrieval Conference, 23-27 Oct 2017, Suzhou, China.

Global Business


Optimizing emergency preparedness and resource utilization in mass-casualty incidents
This paper presents a response model for the aftermath of a Mass-Casualty Incident (MCI) that can be used to provide operational guidance for regional emergency planning as well as to evaluate strategic preparedness plans. A mixed integer programming (MIP) formulation is proposed for the combined ambulance dispatching, patient-to-hospital assignment, and treatment ordering problem. T he goal is to allocate effectively the limited resources during the response so as to improve patient outcomes, while the objectives are to minimize the overall response time and the total flow time required to treat all patients, in a hierarchical fashion. The model is solved via exact and MIP-based heuristic solution methods. The applicability of the model and the performance of the new methods are challenged on realistic MCI scenarios. We consider the hypothetical case of a terror attack at the New York Stock Exchange in Lower Manhattan with up to 150 trauma patients. We quantify the impact of capacity-based bottlenecks for both ambulances and available hospital beds. We also explore the trade-off between accessing remote hospitals for demand smoothing versus reduced ambulance transportation times.
———
Repoussis, P.P., Paraskevopoulos, D. C., Vazacopoulos, A. and Hupert, N. (2016). Optimizing emergency preparedness and resource utilization in mass-casualty incidents. European Journal of Operational Research, 255(2), pp. 531-544. doi: 10.1016/j.ejor.2016.05.047
Structural combination of neural network models
Forecasts combinations normally use point forecasts that were obtained from different models or sources ([1], [2], [3]). This paper explores the incorporation of internal structure parameters of feed-forward neural network (NN) models as an approach to combine their forecasts via ensembles. First, the generated NN models that could be part of the ensembles are subject to a clustering algorithm that uses the structure parameters and, from each of the clusters obtained, a small set of models is selected and their forecasts are combined in a two-stage procedure. Secondly, in an alternative and simpler implementation, a subset of the generated NN models is selected by using several reference points in the model structure parameter space. The choice of the reference points is optimised through a genetic algorithm and the models selected are averaged. Hourly electricity demand time series is used to assess multi-step ahead forecasting performance for up to a 12 hours horizon. Results are compared against several statistical benchmarks, the average of the individual forecasts and the best models in the ensembles. Results show that the clusterbased (CB) structural combinations do better than the genetic algorithm (GA) structural combinations in outperforming the average forecast, which is the traditional point forecast from an ensemble.
———
Rendon, J. and de Menezes, L. M. (2017). Structural combination of neural network models. 2016 IEEE 16th International Conference on Data Mining Workshops (ICDMW), pp. 406-413. doi: 10.1109/ICDMW.2016.0064


FLiquidity in the NBP forward market
Forecasts combinations normally use point forecasts that were obtained from different models or sources ([1], [2], [3]). This paper explores the incorporation of internal structure parameters of feed-forward neural network (NN) models as an approach to combine their forecasts via ensembles. First, the generated NN models that could be part of the ensembles are subject to a clustering algorithm that uses the structure parameters and, from each of the clusters obtained, a small set of models is selected and their forecasts are combined in a two-stage procedure. Secondly, in an alternative and simpler implementation, a subset of the generated NN models is selected by using several reference points in the model structure parameter space. The choice of the reference points is optimised through a genetic algorithm and the models selected are averaged. Hourly electricity demand time series is used to assess multi-step ahead forecasting performance for up to a 12 hours horizon. Results are compared against several statistical benchmarks, the average of the individual forecasts and the best models in the ensembles. Results show that the clusterbased (CB) structural combinations do better than the genetic algorithm (GA) structural combinations in outperforming the average forecast, which is the traditional point forecast from an ensemble.
———
Russo, M., de Menezes, L. M. and Urga, G. (2016). Liquidity in the NBP forward market. 2016 13th International Conference on the European Energy Market (EEM), 2016-J, doi: 10.1109/EEM.2016.7521358
Foundations of Data Science

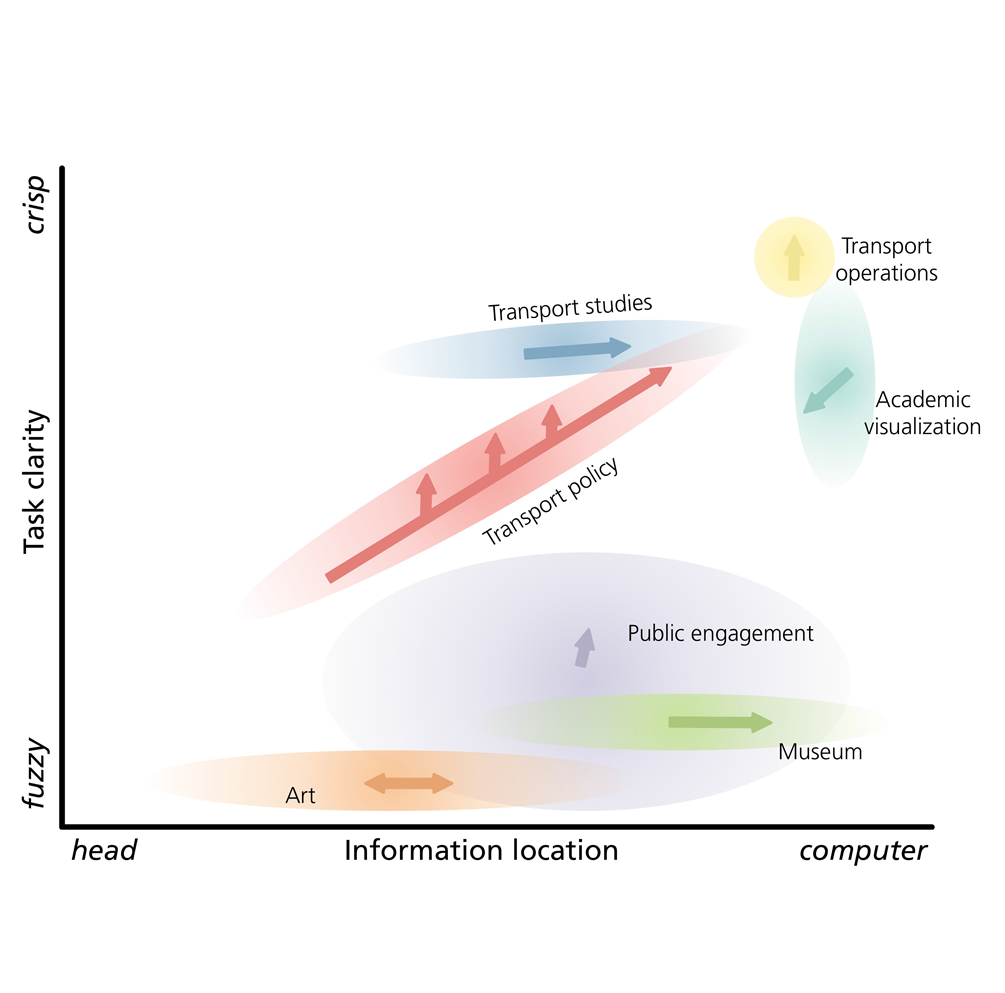
Moving beyond sequential design: Reflections on a rich multi-channel approach to data visualization
We reflect on a four-year engagement with transport authorities and others involving a large dataset describing the use of a public bicycle-sharing scheme. We describe the role visualization of these data played in fostering engagement with policy makers, transport operators, the transport research community, the museum and gallery sector and the general public. We identify each of these as ‘channels’ – evolving relationships between producers and consumers of visualization – where traditional roles of the visualization expert and domain expert are blurred. In each case, we identify the different design decisions that were required to support each of these channels and the role played by the visualization process. Using chauffeured interaction with a flexible visual analytics system we demonstrate how insight was gained by policy makers into gendered spatio-temporal cycle behaviors, how this led to further insight into workplace commuting activity, group cycling behavior and explanations for street navigation choice. We demonstrate how this supported, and was supported by, the seemingly unrelated development of narrative-driven visualization via TEDx, of the creation and the setting of an art installation and the curating of digital and physical artefacts. We assert that existing models of visualization design, of tool/technique development and of insight generation do not adequately capture the richness of parallel engagement via these multiple channels of communication. We argue that developing multiple channels in parallel opens up opportunities for visualization design and analysis by building trust and authority and supporting creativity. This rich, non-sequential approach to visualization design is likely to foster serendipity, deepen insight and increase impact.
Wood, J., Beecham, R. & Dykes, J. (2014). Moving beyond sequential design: Reflections on a rich multi-channel approach to data visualization. IEEE Transactions on Visualization and Computer Graphics, 20(12), pp. 2171-2180. doi: 10.1109/TVCG.2014.2346323
VAST Challenge 2016
After the successful resolution of the 2014 kidnapping at GAStech’s Abila, Kronos office, GAStech officials determined that Abila offices needed a significant upgrade. In 2015, the growing company moved into a state-of-the-art three-story building near their previous location. The new office is built to the highest energy efficiency standards, and it is fully instrumented with sensors that identify everything from building temperatures to concentration levels of various chemicals.
GAStech has recently introduced new security processes. Staff members are now required to wear proximity (prox) cards while in the building, so that incidents like the 2014 kidnapping cannot occur again.
As an expert in visual analytics, you have been hired to help GAStech understand its steady stream of operations data. This includes data from stationary and mobile sensors of multiple types. The company needs your help in operational issues as well as security issues. Can you identify the issues to safeguard the company’s employees?
Mini-Challenge 2 asks you to analyze two weeks of building sensor data to identify patterns of concern. Please see VAST Challenge 2016: Mini-Challenge 2 for more information.

Energy

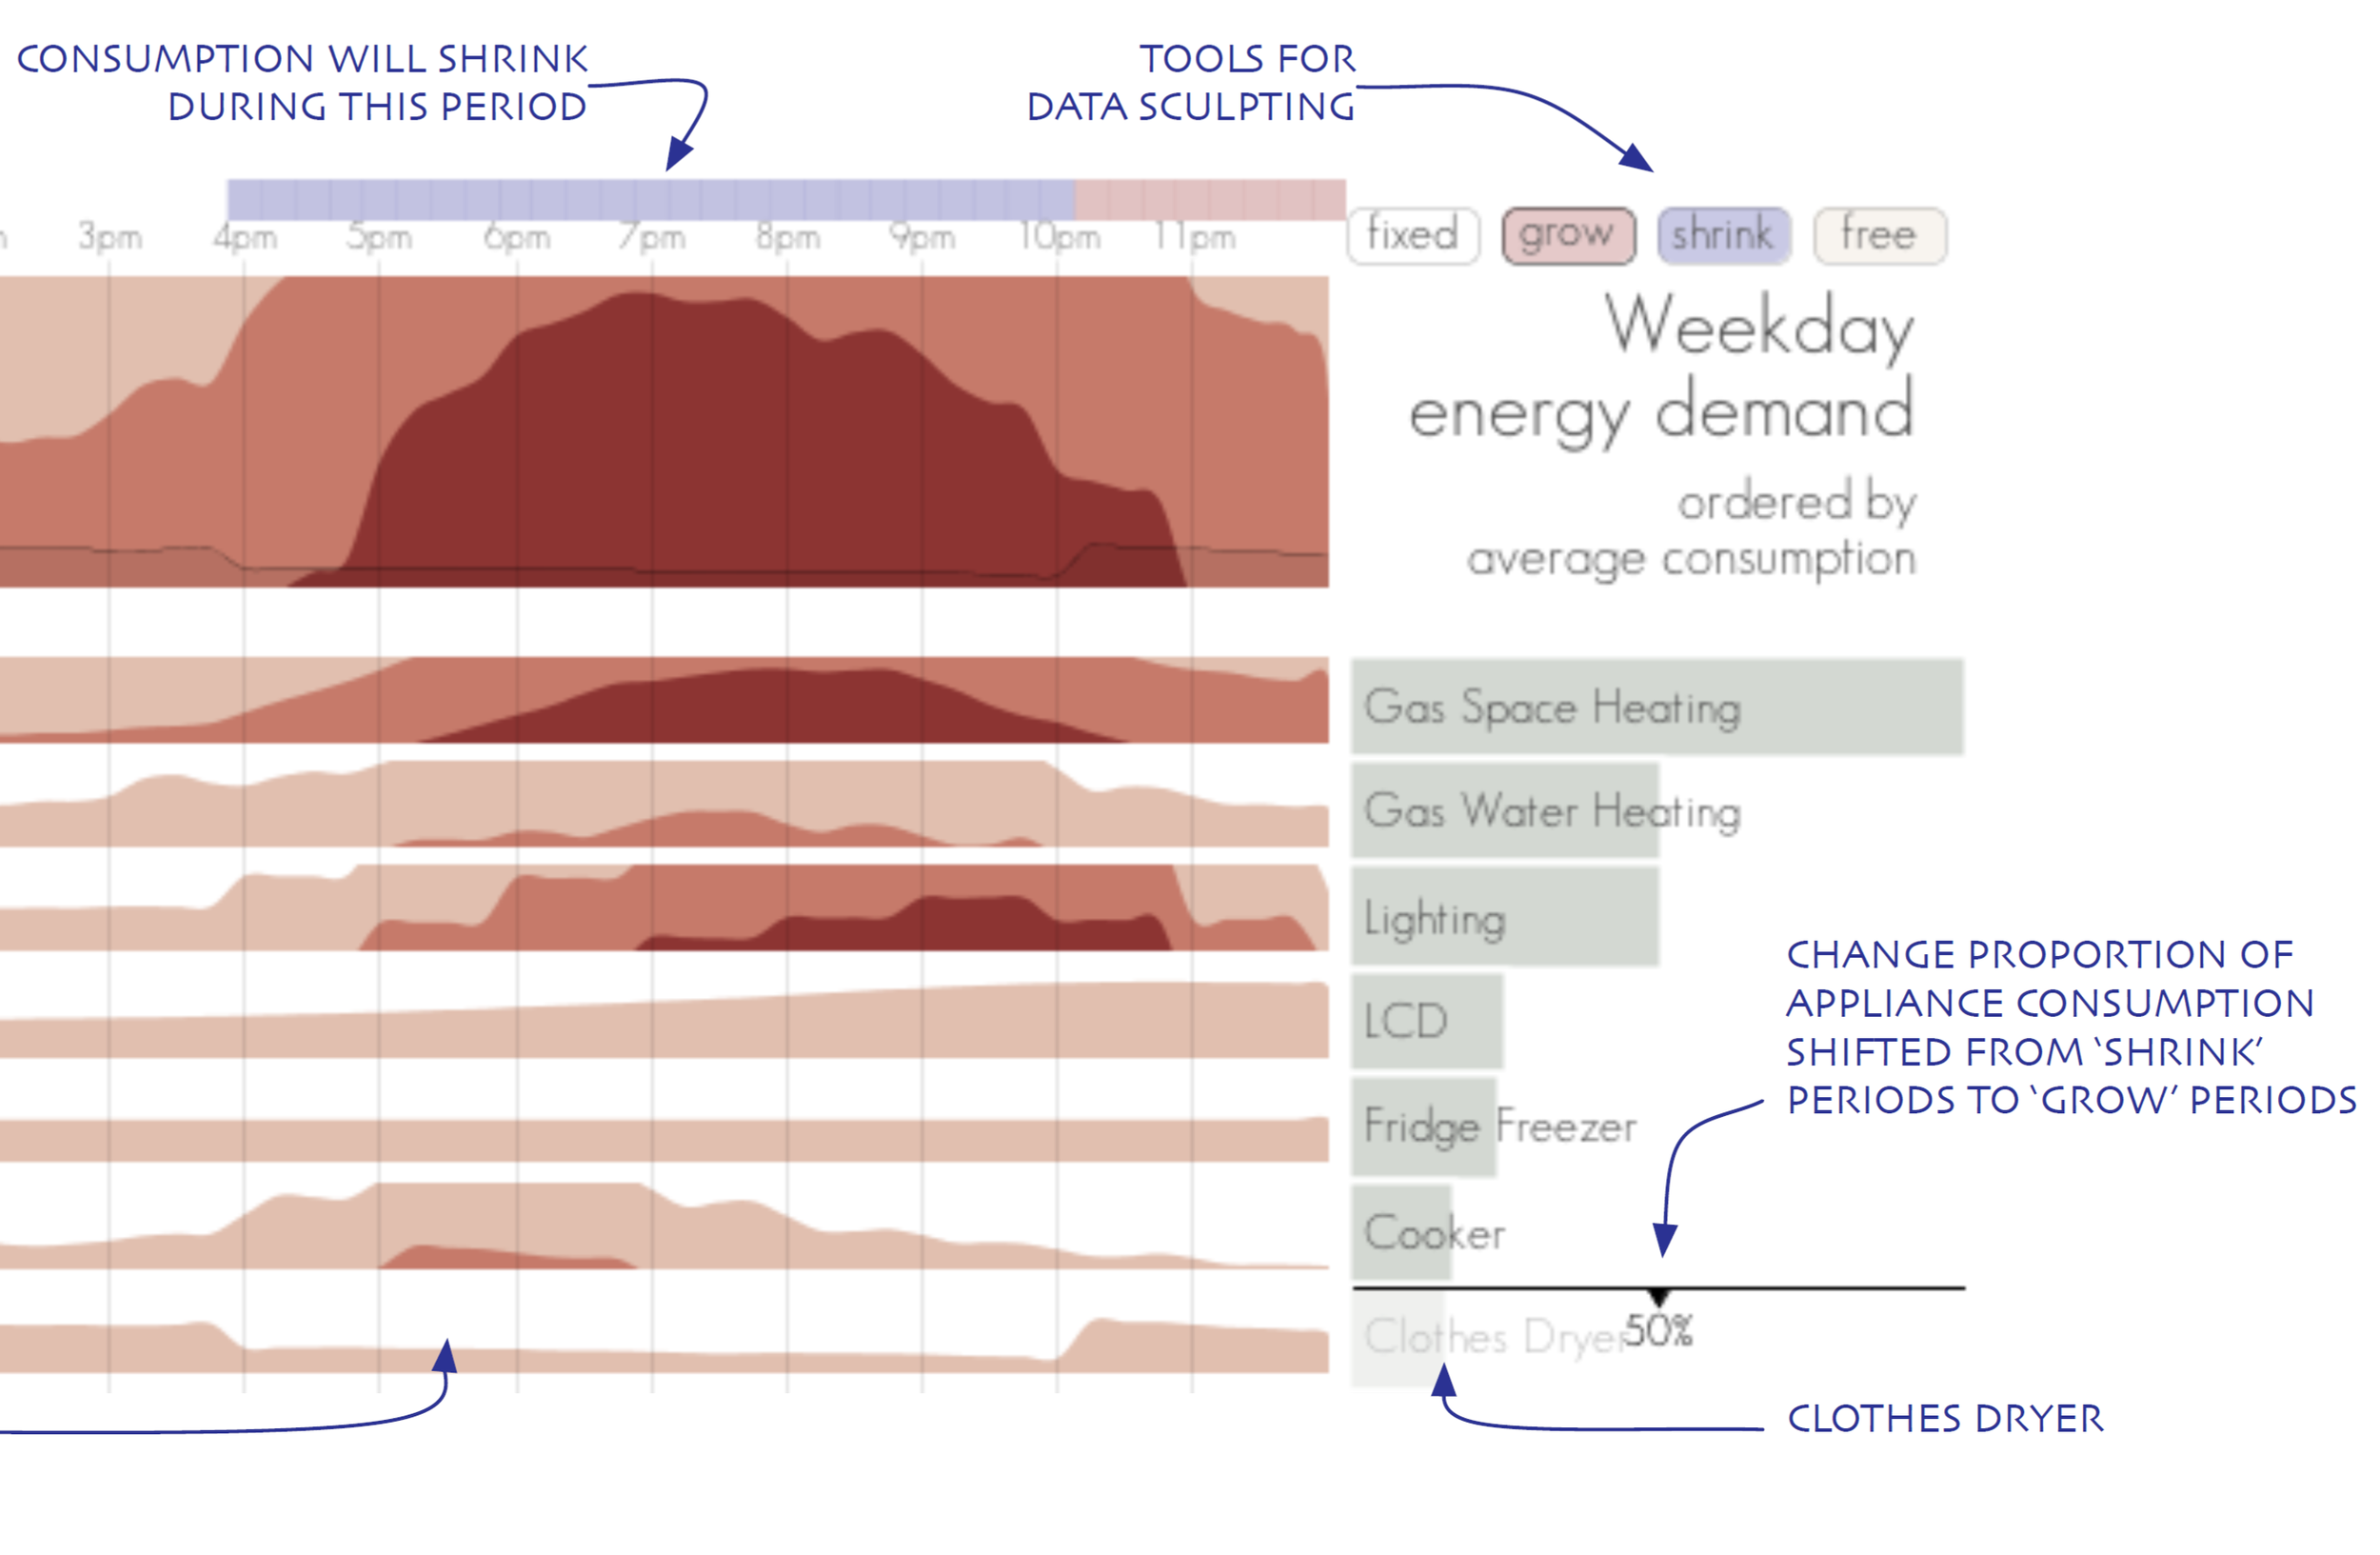
Creative User-Centered Visualization Design for Energy Analysts and Modelers
We enhance a user-centered design process with techniques that deliberately promote creativity to identify opportunities for the visualization of data generated by a major energy supplier. Visualization prototypes developed in this way prove effective in a situation whereby data sets are largely unknown and requirements open – enabling successful exploration of possibilities for visualization in Smart Home data analysis. The process gives rise to novel designs and design metaphors including data sculpting. It suggests: that the deliberate use of creativity techniques with data stakeholders is likely to contribute to successful, novel and effective solutions; that being explicit about creativity may contribute to designers developing creative solutions; that using creativity techniques early in the design process may result in a creative approach persisting throughout the process. The work constitutes the first systematic visualization design for a data rich source that will be increasingly important to energy suppliers and consumers as Smart Meter technology is widely deployed. It is novel in explicitly employing creativity techniques at the requirements stage of visualization design and development, paving the way for further use and study of creativity methods in visualization design.
Goodwin, S., Dykes, J., Jones, S., Dillingham, I., Dove, G., Duffy, A., Kachkaev, A., Slingsby, A. and Wood, J. (2013). Creative User-Centered Visualization Design for Energy Analysts and Modelers. IEEE Transactions on Visualization and Computer Graphics, 19(12), pp. 2516-2525. doi: 10.1109/TVCG.2013.145
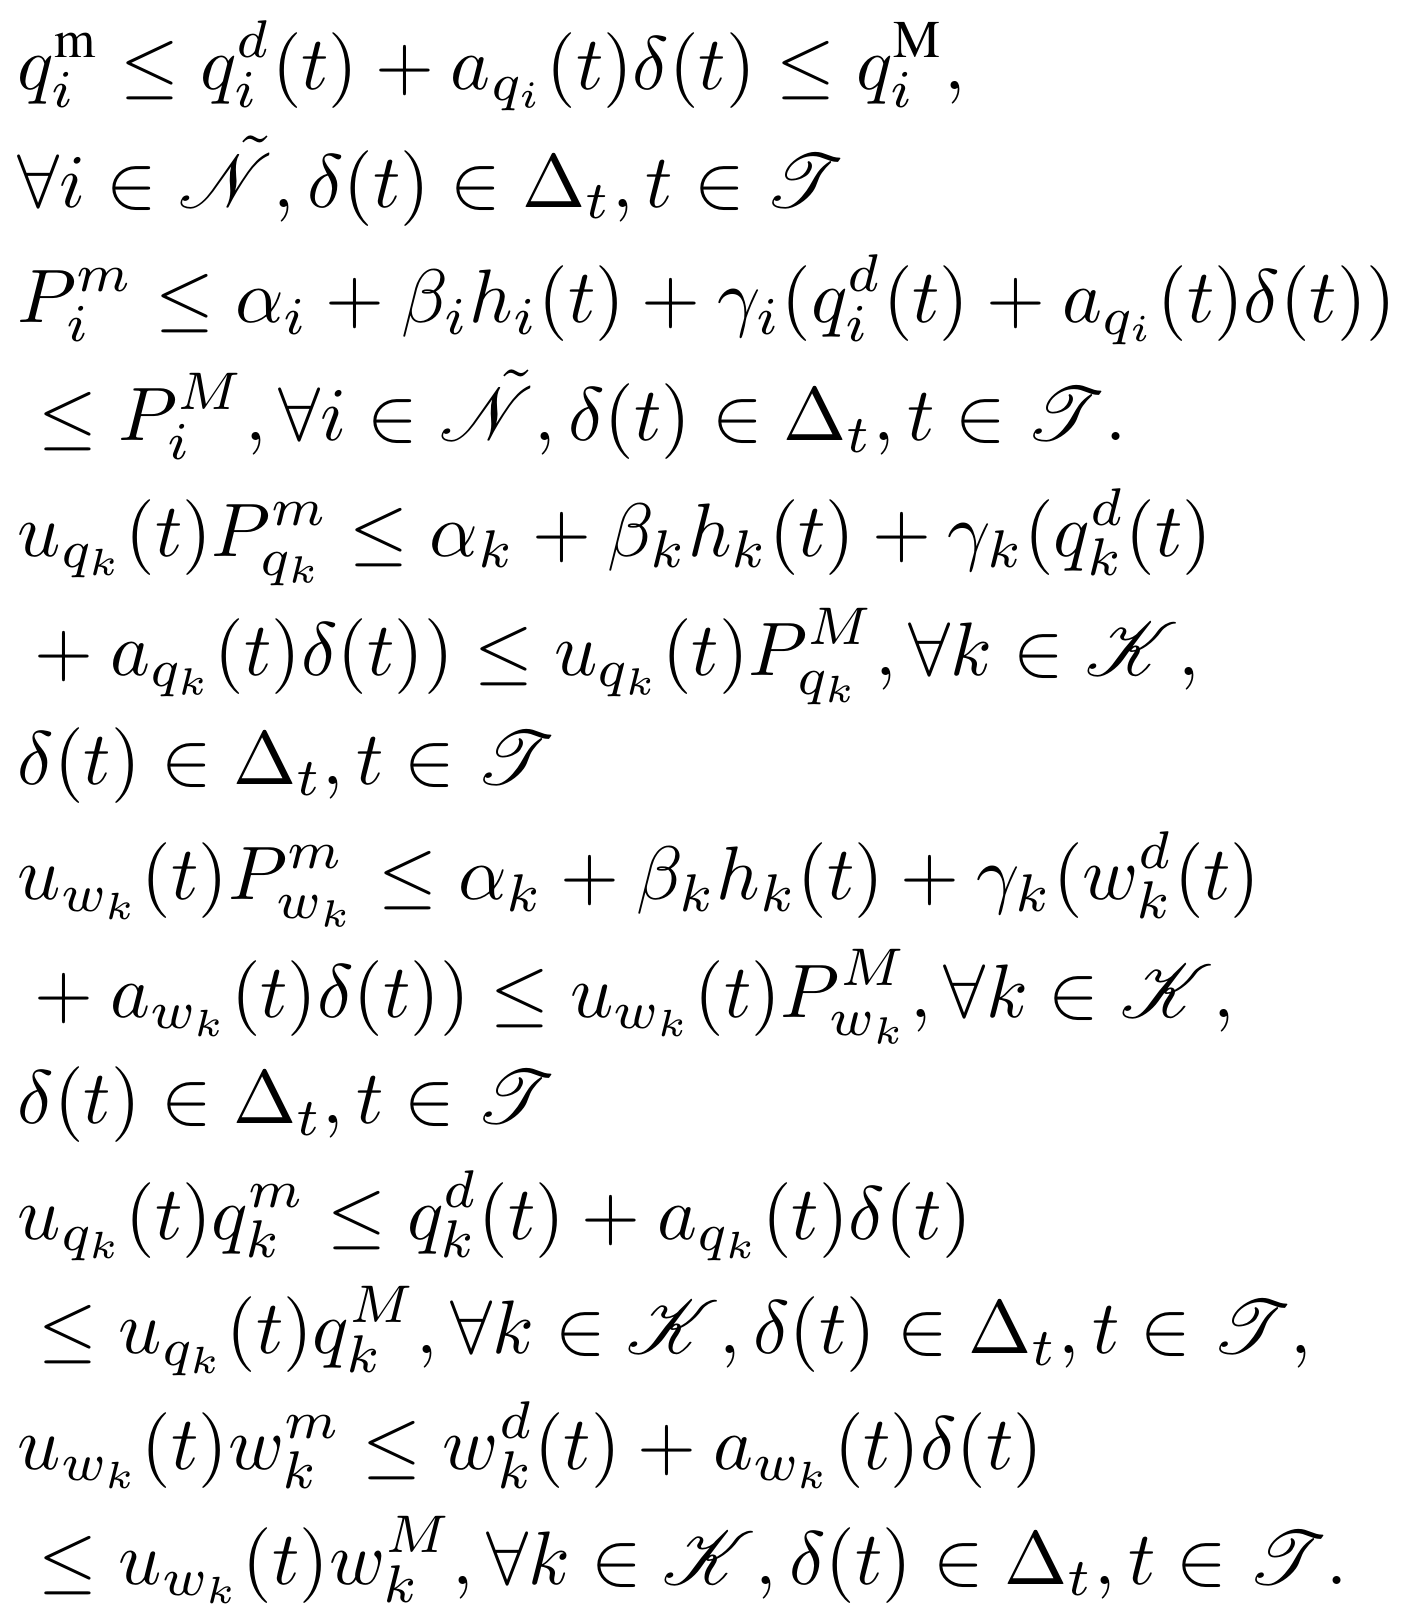
Optimal Dispatch of Pumped Storage Hydro Cascade under Uncertainty
In this paper, we propose an optimal dispatch scheme for a pumped storage hydro cascade that maximizes the energy per cubic meter of water in the system taking into account uncertainty in the net load variations. To this end, we introduce a model to describe the behaviour of a pumped storage hydro cascade and formulate its optimal dispatch. We then incorporate forecast scenarios in the optimal dispatch, and define a robust variant of the developed system. The resulting optimization problem is intractable due to the infinite number of constraints. Using tools from robust optimization, we reformulate the resulting problem in a tractable form that is amenable to existing numerical tools and show that the computed dispatch is immunised against uncertainty. The efficacy of the proposed approach is demonstrated by means of a realistic case study based on the Seven Forks system located in Kenya.
———
Najibi, F., Alonso, E. and Apostolopoulou, D. (2018). Optimal Dispatch of Pumped Storage Hydro Cascade under Uncertainty. Paper presented at the Control 2018 – 12th International UKACC Conference on Control, 05 - 07 September 2018, Sheffield, UK.